The Analytics section provides a detailed overview of the performance of the funnels you’ve created. This powerful tool helps you track key metrics, measure the success of your funnels, and identify opportunities for optimization. Whether you’re monitoring conversions, revenue, or customer engagement, the analytics dashboard gives you the insights you need to make data-driven decisions and improve your strategy.
There are two ways to view your funnel analytics:
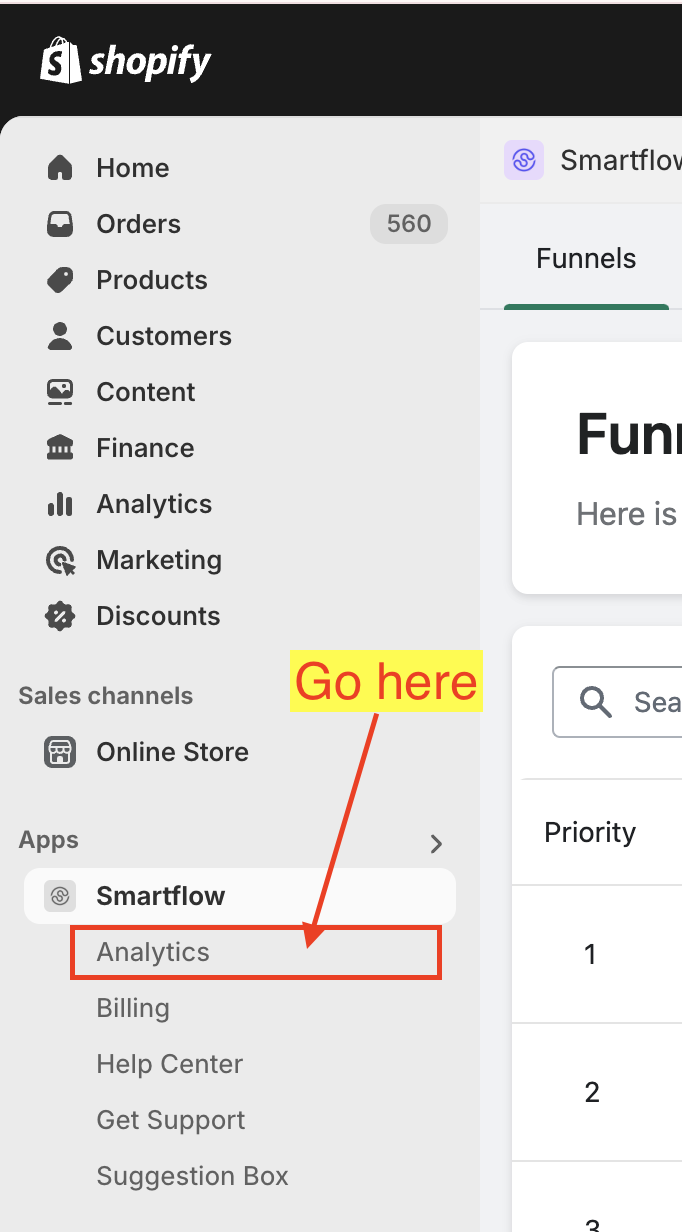
Through the "Analytics" tab:
In the app's navigation menu, choose "Analytics." This will take you directly to the Analytics tab.
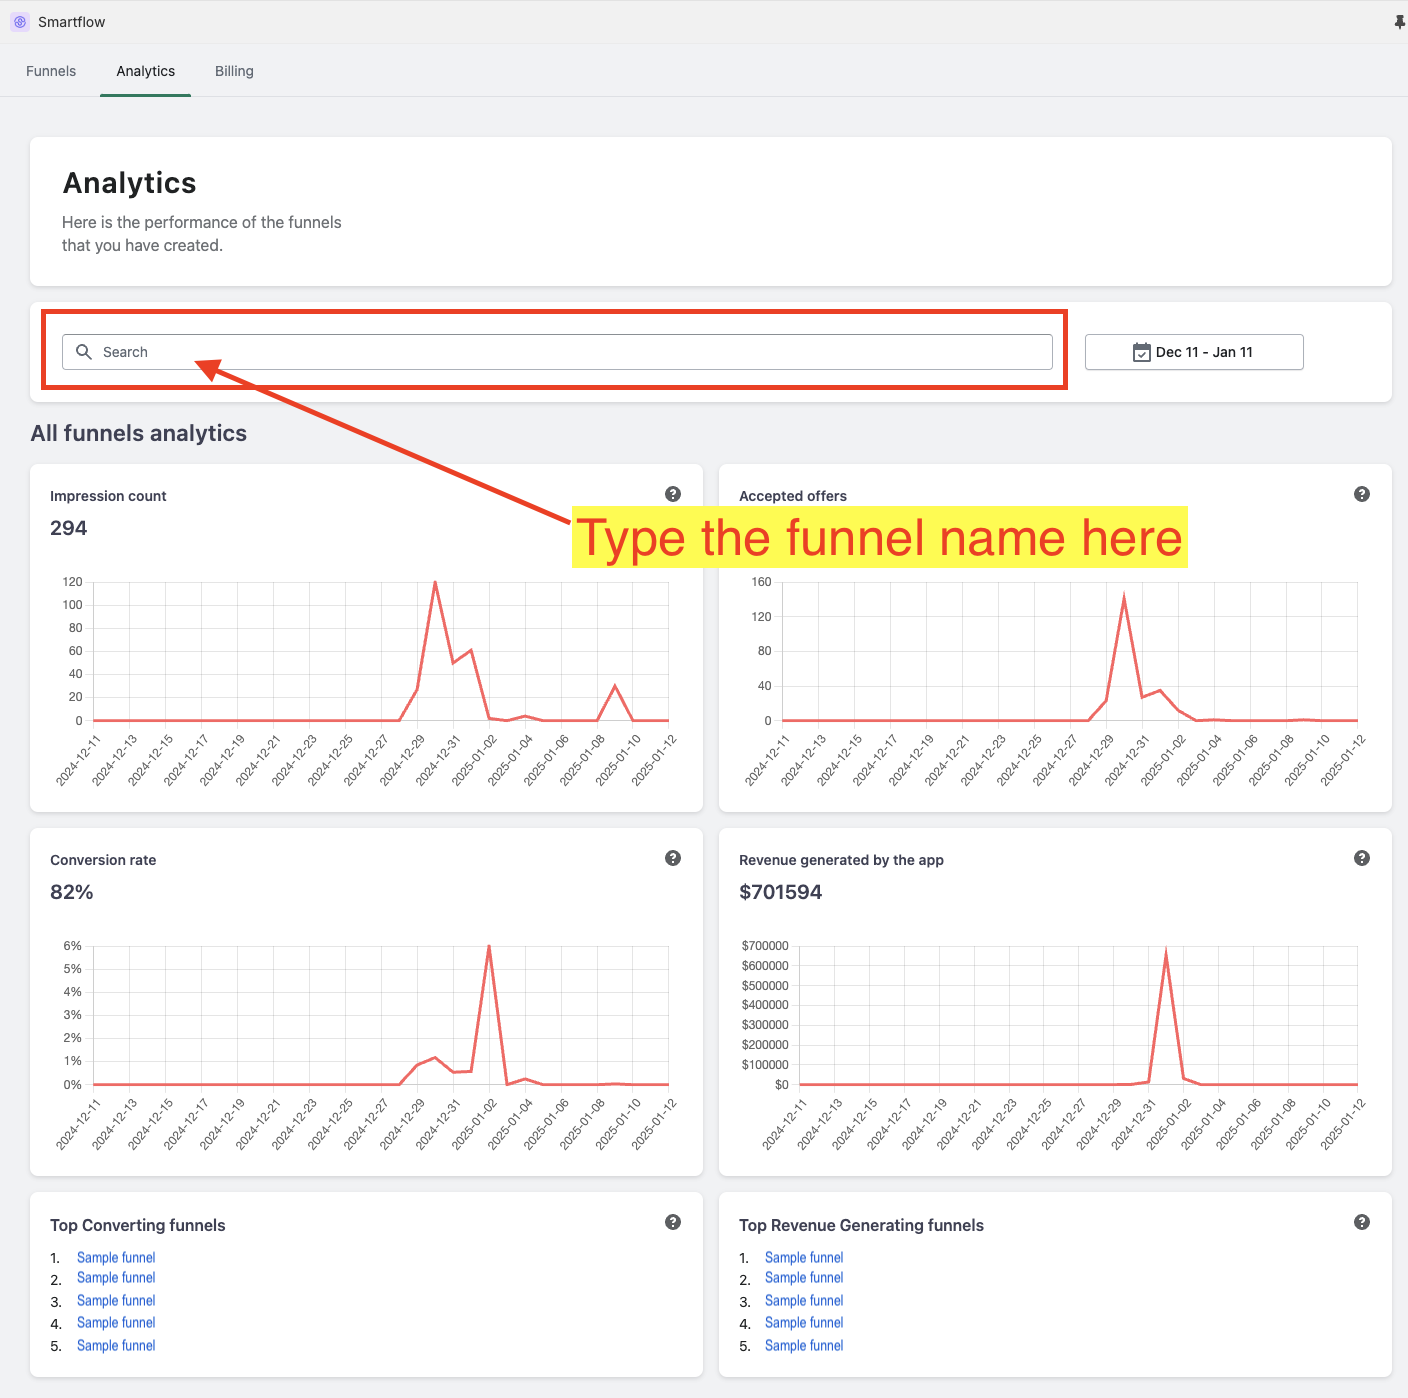
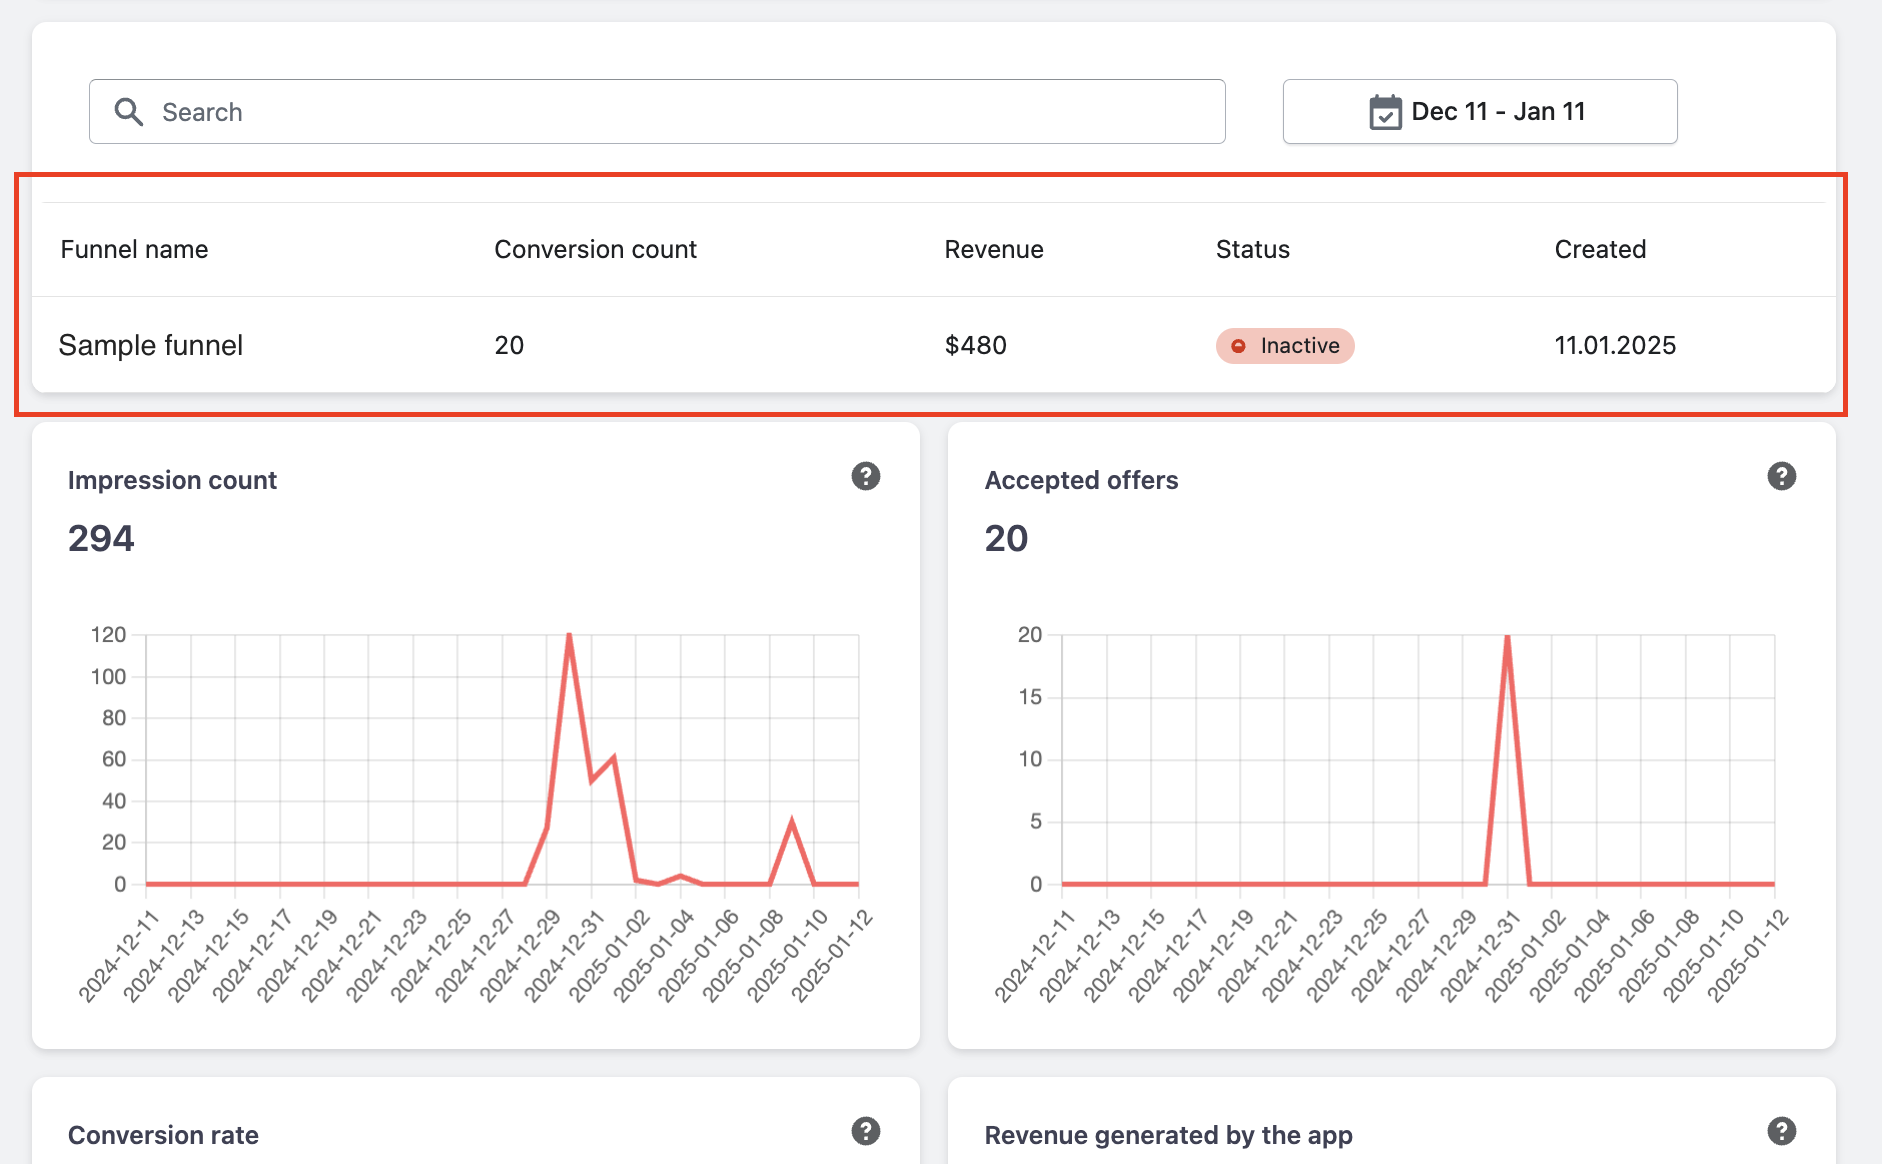
By default, it will display the combined data for all your funnels. Use the "Search" bar to filter the data for a specific funnel.
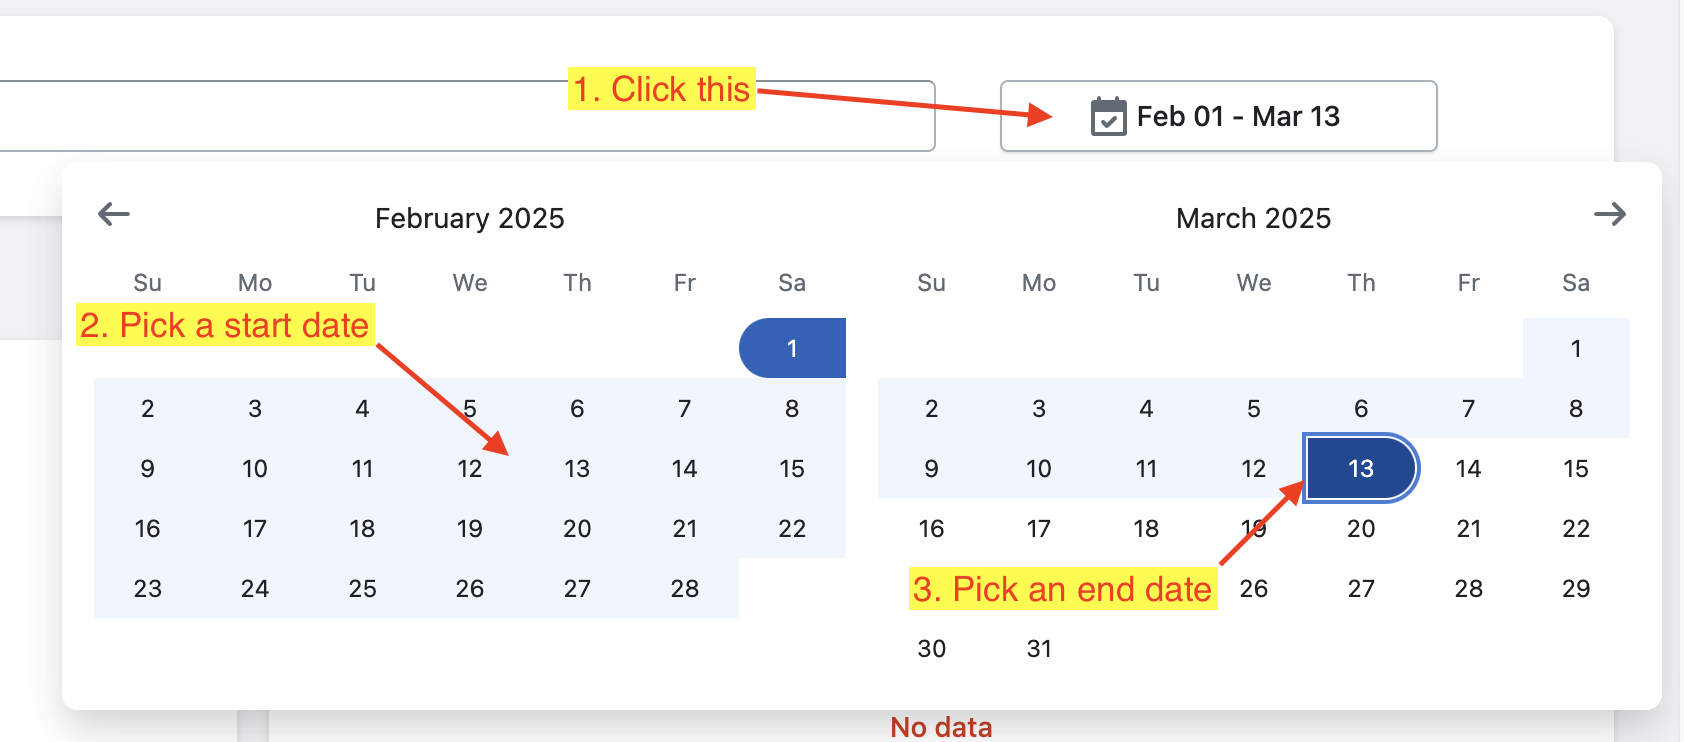
Use the date filters to further narrow it down to a specific date range.
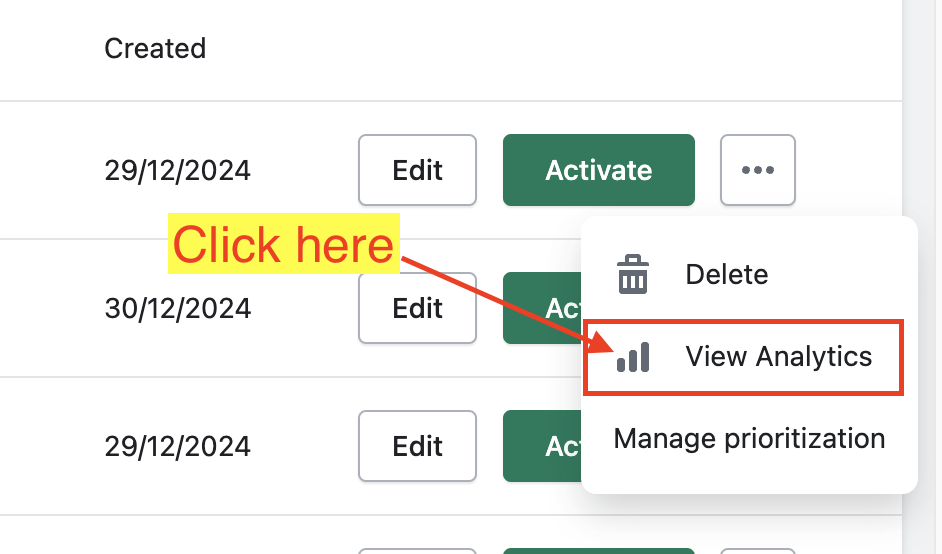
Through the "Action" buttons:
In the app dashboard, select the funnel you want to view.
Click the "Analytics" button to go directly to the Analytics tab.
It will display data only for that specific funnel.
Here are the key analytics available:
Impression Count: The total number of times your funnels have been shown to your customers.
Accepted Offers: The total number of times your customers have accepted the offers.
Conversion Rate: The percentage of accepted offers compared to the impression count.
Revenue Generated by the App: The total revenue attributed to your funnels.
Top Converting Funnels: The funnels with the highest conversion rates.
Top Revenue-Generating Funnels: The funnels that have generated the most revenue.
Keywords:
What key metrics can I track in the SmartFlow Analytics section to measure funnel performance?
How do I identify top-performing funnels using the SmartFlow Analytics dashboard?
How do I check for my analytics?